Driving Operational Efficiency Through Data-Driven Insights
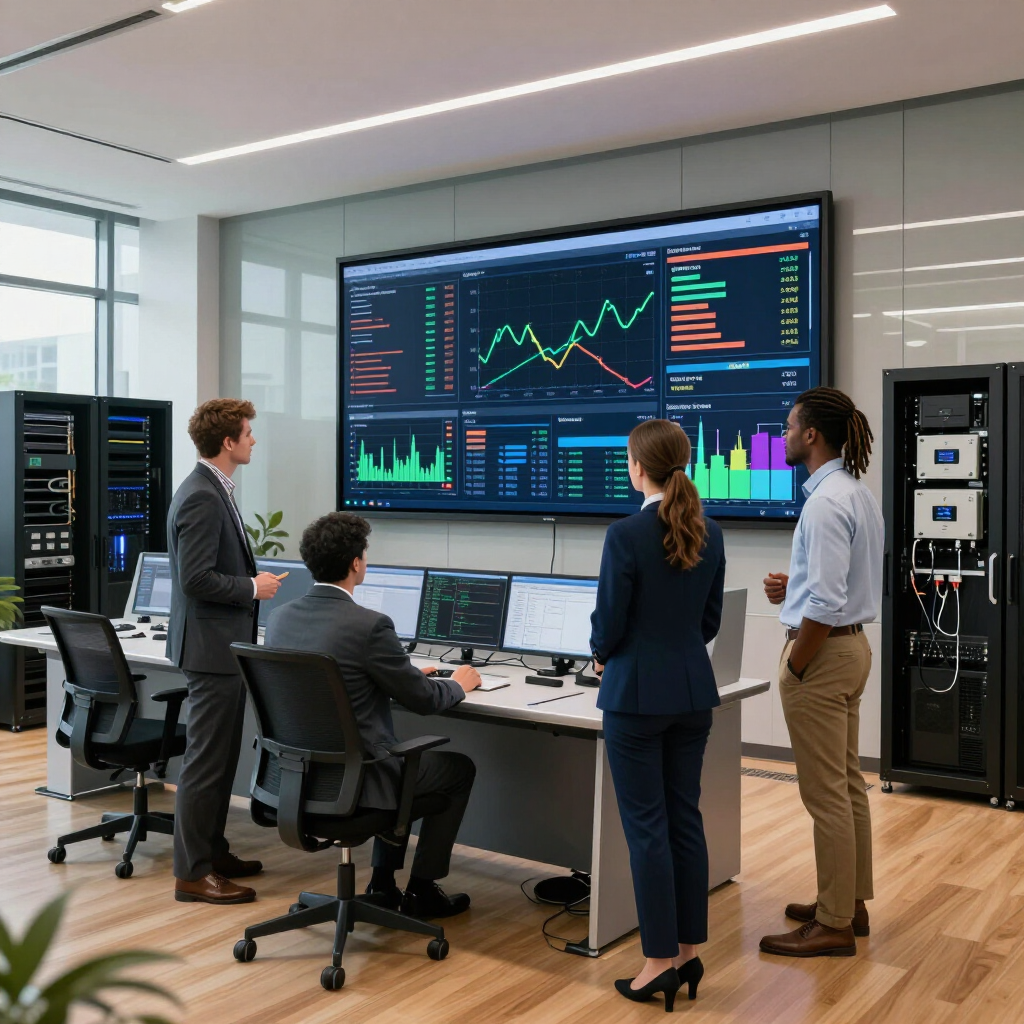
As utility costs rise and sustainability demands increase, energy analytics has emerged as a powerful tool for commercial property owners and facility managers. While traditional utility tracking methods—like reviewing monthly bills—can reveal trends, they often lack the detail and responsiveness required to manage today’s complex buildings.
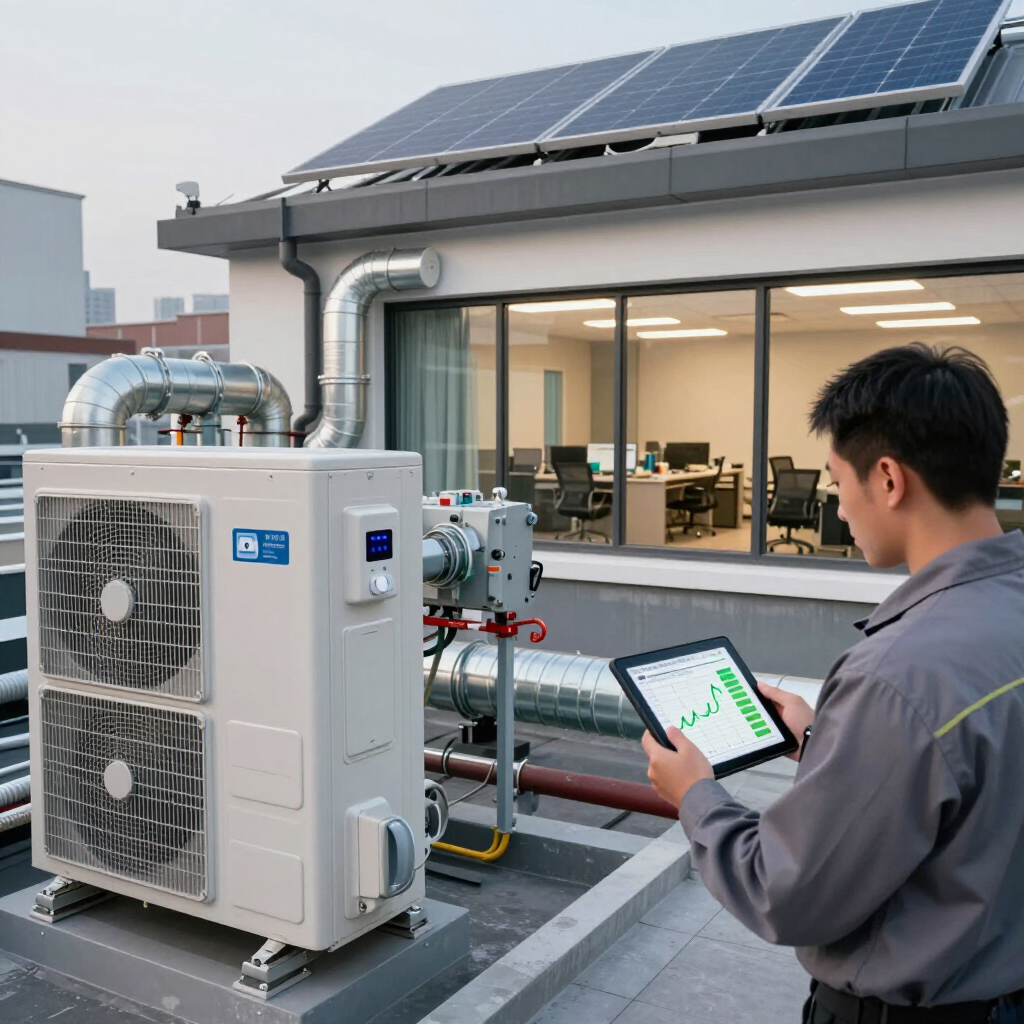
Energy analytics transforms raw utility data into actionable insights. Through advanced monitoring platforms, real-time dashboards, and smart sensors, businesses can detect inefficiencies, control consumption, and reduce costs with greater accuracy than ever before.
For commercial properties across Minnesota—from office buildings in Minneapolis to manufacturing facilities in Rochester—energy analytics is becoming the backbone of modern utility management.
This article explores what energy analytics is, how it works, and why it’s essential for businesses looking to optimize energy performance in 2026 and beyond.
What Is Energy Analytics?
Energy analytics is the process of collecting, analyzing, and interpreting data related to a building’s energy use. It goes beyond simple meter readings or monthly billing totals. Instead, it provides a detailed, real-time understanding of how, when, and where energy is being used throughout a facility.
Key components of energy analytics include:
- Real-time energy monitoring
- Interval data collection (every 5–15 minutes)
- System-level or zone-level submetering
- Trend analysis and usage forecasting
- Anomaly and fault detection
- Automated reporting and alerts
Energy analytics tools are typically delivered via cloud-based platforms that integrate with building automation systems (BAS), submeters, or utility meters.
Why Energy Analytics Matters for Utility Management
Traditional utility bill reviews are reactive. By the time a problem appears on the bill, it’s too late—the energy has already been used, and the cost incurred.
Energy analytics allows for a proactive approach. By monitoring performance in real time, facility teams can detect spikes, inefficiencies, or equipment failures as they happen—and respond before waste accumulates.
This approach supports several key goals:
- Reducing total energy consumption
- Managing peak demand and load shifting
- Improving equipment reliability
- Supporting sustainability and reporting goals
- Verifying the success of energy efficiency projects
Key Benefits of Energy Analytics for Commercial Buildings
Better energy decisions start with better data. Here’s how energy analytics supports commercial utility management:
1. Real-Time Visibility
Dashboards and live monitoring platforms show current usage across systems, zones, or equipment. This allows facility teams to:
- Identify which systems are driving consumption
- Track energy use by time of day or occupancy pattern
- Compare current use to historical or expected baselines
With real-time feedback, teams can correct wasteful behavior or misconfigurations immediately.
2. Equipment Performance Monitoring
Analytics systems detect abnormal energy signatures, helping identify equipment that is:
- Running inefficiently
- Operating outside of scheduled times
- Short-cycling or overloading
Early detection of these issues reduces maintenance costs and avoids surprise breakdowns, particularly in HVAC, lighting, or refrigeration systems.
3. Demand Charge Management
In Minnesota and other regions with demand-based billing, analytics tools can help prevent expensive demand spikes. Features include:
- Predicting upcoming demand based on current trends
- Alerting staff when thresholds are close
- Staggering equipment startup to avoid simultaneous peaks
Demand charge mitigation can save thousands annually, especially in buildings with large equipment or irregular load patterns.
4. Benchmarking and Goal Tracking
Energy analytics platforms allow facility managers to:
- Set consumption targets by building, system, or tenant
- Benchmark performance against similar buildings
- Track the impact of upgrades or operational changes
This makes it easier to justify future investments, comply with local regulations, or meet internal sustainability KPIs.
5. Streamlined Reporting
Analytics tools automate monthly, quarterly, and annual energy reporting. These reports are helpful for:
- Sharing progress with ownership or investors
- Meeting local benchmarking ordinances (such as in Minneapolis)
- Supporting ENERGY STAR or LEED certifications
- Identifying year-over-year trends
How Energy Analytics Works
Energy analytics systems collect data from multiple sources, such as:
- Main utility meters (electric, gas, water)
- Submeters for tenants or systems (HVAC, lighting, plug loads)
- Building automation systems (BAS)
- Smart sensors (temperature, humidity, occupancy)
Data is stored in the cloud and processed through analytics software, which applies algorithms to identify:
- Consumption trends
- Efficiency deviations
- Equipment faults
- Anomalies or unusual patterns
The results are displayed in an intuitive dashboard that users can access from a desktop, tablet, or smartphone.
Applications for Minnesota Businesses
Energy analytics is especially valuable in high-consumption or complex environments. Common applications include:
- Office buildings with mixed-use spaces or variable occupancy
- Manufacturing facilities with heavy machinery and shift work
- Schools and campuses with fluctuating schedules
- Restaurants with refrigeration, HVAC, and kitchen loads
- Multi-tenant properties needing submetered tracking
By implementing analytics, Minnesota businesses can adapt to extreme seasonal weather, avoid high winter heating loads, and better prepare for summer demand charges.
Getting Started with Energy Analytics
Eco Energy Solutions MN helps clients across Minneapolis, St. Paul, Rochester, and other Minnesota regions implement energy analytics solutions tailored to their building type and utility profile.
Here’s how to begin:
- Conduct a Commercial Energy Audit
Assess your current utility usage, major loads, and opportunities for savings. - Install Submetering and Monitoring Equipment
Target key systems like HVAC, lighting, and refrigeration. - Integrate with a Cloud-Based Dashboard
Visualize energy trends, set alerts, and benchmark performance. - Train Your Team
Ensure your facilities or operations team understands how to interpret the data and respond to issues. - Review Regularly
Use the platform for ongoing utility management, project verification, and capital planning.
Frequently Asked Questions
How much does an energy analytics system cost?
Costs vary depending on the size of the building and the number of meters or systems being tracked. However, most systems pay for themselves within 1 to 3 years through utility savings alone.
Is energy analytics only for large buildings?
No. While large properties see big benefits, smaller buildings can also reduce waste and detect issues earlier with scaled-down systems.
Do I need a building automation system (BAS) to use analytics?
Not necessarily. Many platforms integrate with standalone submeters or sensors and can function without a full BAS.
What types of savings can I expect?
Savings vary but commonly range from 10% to 20% annually, especially when paired with efficiency upgrades and proactive facility management.
Use Data to Drive Smarter Utility Management
In today’s energy landscape, reacting to utility bills after they arrive is no longer enough. Energy analytics gives commercial property managers and owners the tools they need to control usage, reduce costs, and plan for the future.
Whether you manage a small retail space, a high-rise office, or an industrial plant, Eco Energy Solutions MN LLC can help you implement analytics tools that reveal what’s really driving your energy bills—and how to fix it.
Schedule a free energy analytics consultation today:
https://www.minnesotaecoenergysolutions.com/contact
Recent Posts